|
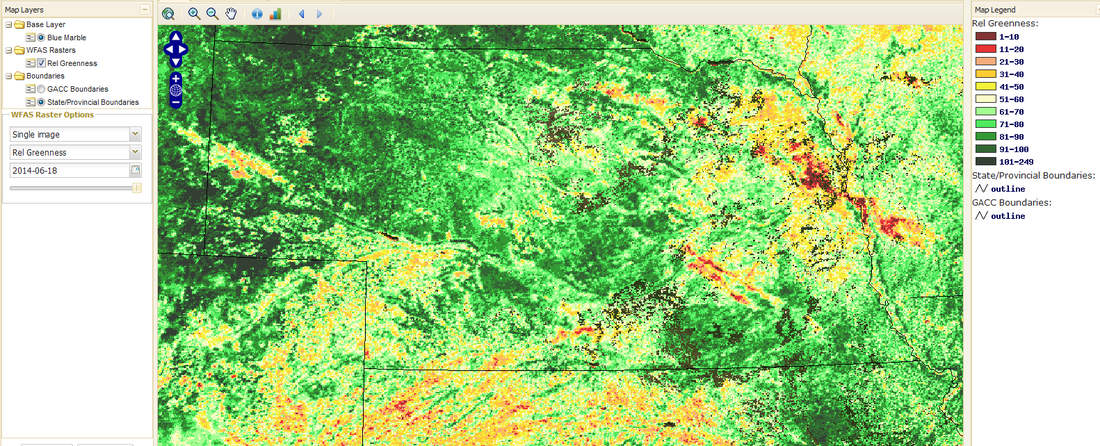
This is the latest Greenness Map from the USFS - WFAS using satellite NDVI (Normalized Difference Vegetation Index). The map shows the Relative Greenness during the June 17-June 23 time period compared to the average greenness from 1989-2003. You can see the path of the large hail and damaging wind events in NE Nebraska, east of Grand Island, and south of Holdrege. Some of the other yellow/red areas may be due to short-lived/isolated thunderstorm damage, late growing conditions due to the drought, or earlier-than-normal maturing wheat.
0 Comments
Leave a Reply. |
AuthorI study weather and climate impacts on agriculture, climate variability, and using weather and climate information to make better agricultural decisions. Archives
November 2017
|
| Ag Climate Nebraska |
|


 RSS Feed
