|
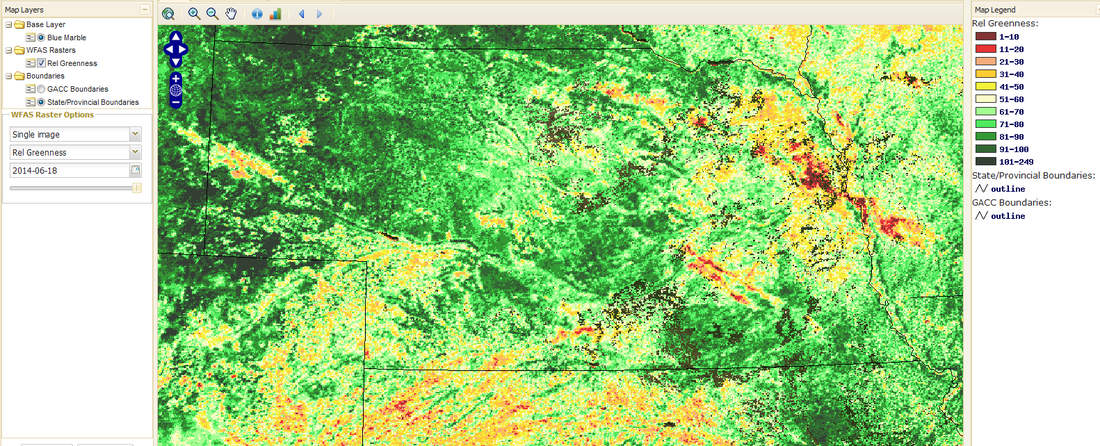
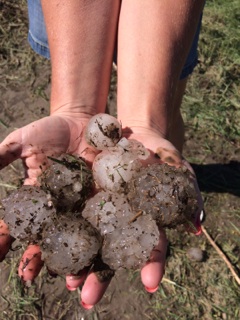
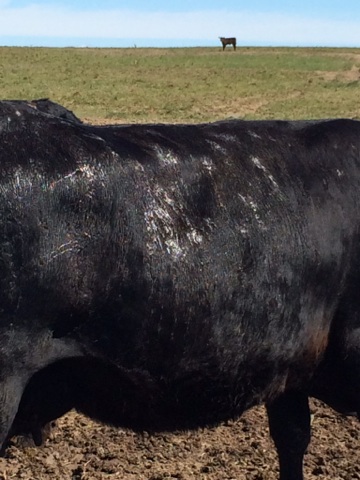
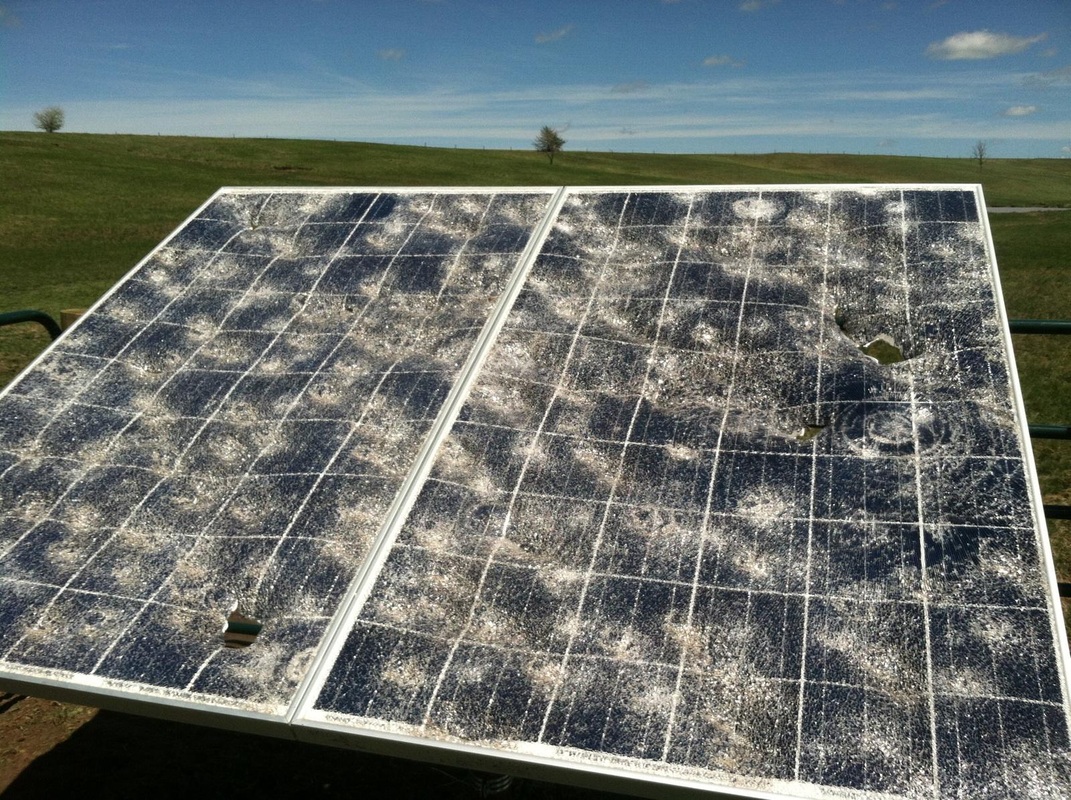
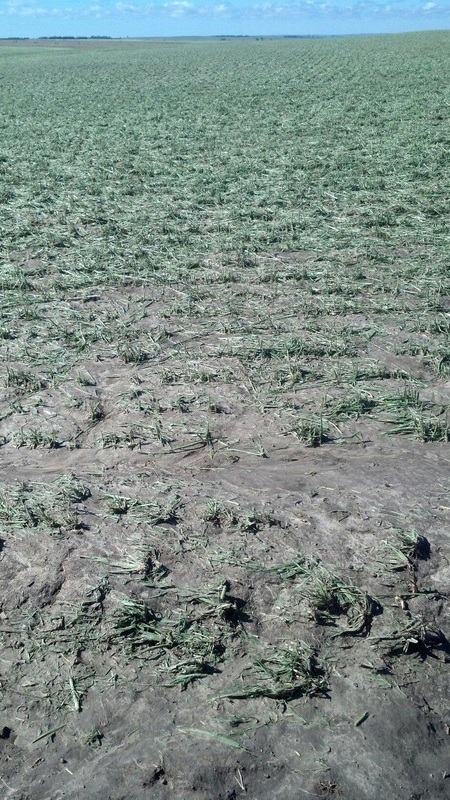
This is the latest Greenness Map from the USFS - WFAS using satellite NDVI (Normalized Difference Vegetation Index). The map shows the Relative Greenness during the June 17-June 23 time period compared to the average greenness from 1989-2003. You can see the path of the large hail and damaging wind events in NE Nebraska, east of Grand Island, and south of Holdrege. Some of the other yellow/red areas may be due to short-lived/isolated thunderstorm damage, late growing conditions due to the drought, or earlier-than-normal maturing wheat.
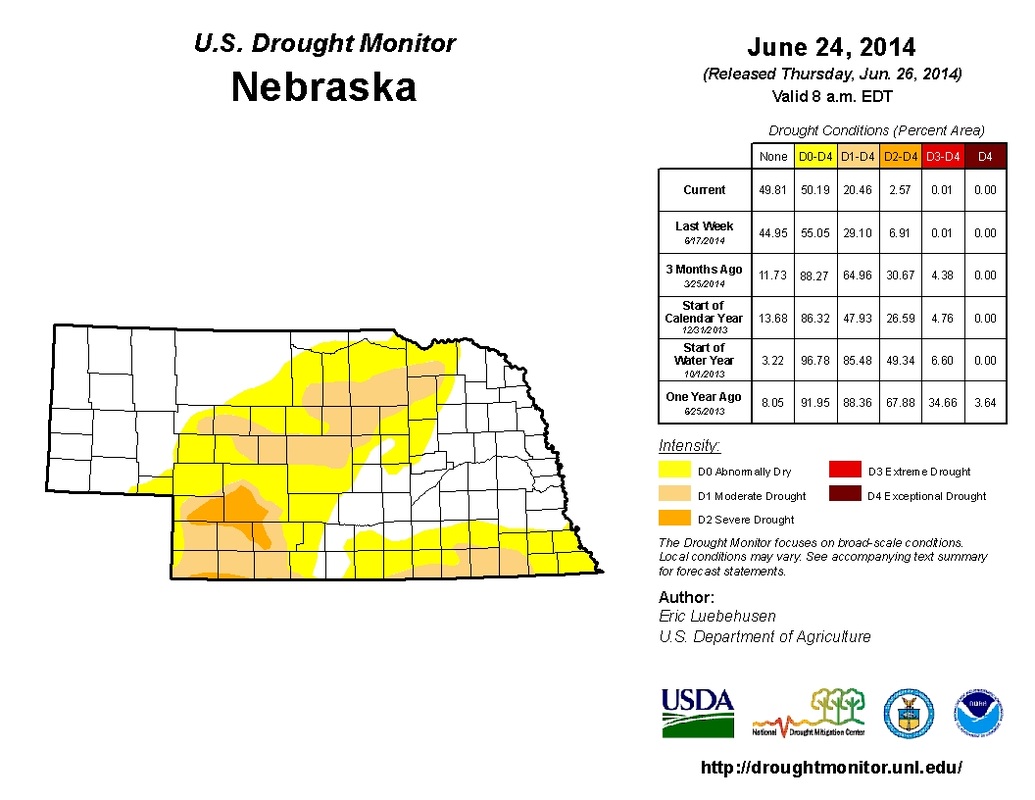
Here is the latest Drought Monitor for Nebraska from the National Drought Mitigation Center. There has been a lot of improvement for Nebraska
UNL Extension has created a page for the many Nebraskans dealing with the storm damage the past few weeks. They provide information for crops, livestock, financial resources, and more.
Click here for the UNL Extension Disaster Recovery page. |
AuthorI study weather and climate impacts on agriculture, climate variability, and using weather and climate information to make better agricultural decisions. Archives
November 2017
|
| Ag Climate Nebraska |
|
 RSS Feed
