A picture can tell a thousand words, but data can produce a lot of pictures. Studying data is often tedious, but it can provide a picture to help us understand the questions we have. This year was unique because of the unseasonably warm temperatures in March and the cold, snowy weather in mid May. This sparked a couple questions: 1) Is there a correlation between an early warm up and the last hard (28 F) freeze? 2) What is the trend in warm temperatures in March? 3) What is the trend in the date of the last hard freeze? The graphs below help to answer those questions. (click graph for larger version)
THE GRAPHS
The blue line represents the last time during the spring the Scottsbluff weather station hit 28 degrees Fahrenheit from 1893-2014. The scale on the left is in Julian Days, which counts the days of the year starting on January 1. (Example: 91 is April 1 and 121 is May 1) The red line is the average max temperature during March for the given year in Degrees Fahrenheit (F). The solid black line is the 10 year moving average and the dashed black line is the long-term (1893-2014) linear trend for the date for the last 28F freeze. The solid orange line is the 10 year average max March temperature and the dashed orange line is the long-term (1893-2014) average max temperature. I have not calculated statistics on this data and the trends are based on data from NOAA-ACIS and visual clues from the graphs.
THE TRENDS
Just quickly looking at the data, the long-term trends are easy to find. The trend for the 28F freeze date is occurring earlier at a rate of about 5 days earlier for every 132 years. That is about one day earlier every 26 years. If we assume the the date of the first fall 28F freeze remains constant (it doesn't), the growing season is actually extending over the course of the recorded data. The average max temperature trend for March is warming by about 3F every 132 years, which is a warming rate of 1F every 44 years.
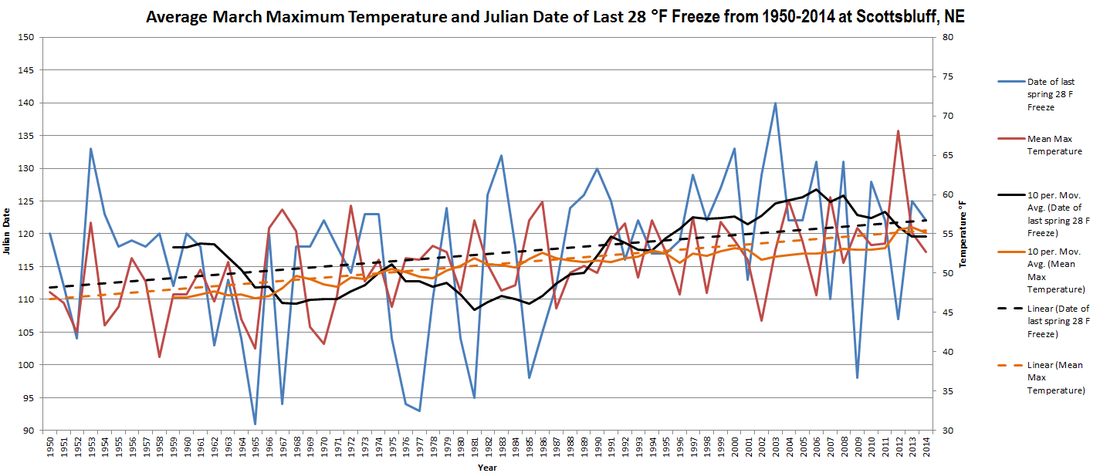
Depending on which years you focus on, the trends may change. If we look at the data from 1950 - 2014, the average last 28F freeze occurs 10 days later every 65 years. That is shortening our growing season by 1 day every 6.5 years, which is a trend in the opposite direction from the 132 year average. The March maximum temperature trend is warming by about 8F per 65 years from 1950-2014. That is an increasing trend of 1F every 8 years, which is a much steeper change than the 132 year average.
Looking at the last 30 years of data from 1985-2014 (not pictured), the trends shift again. The trend for the date of the last 28 F freeze is that it occurs 1 day later every 6 years. The March maximum temperature trend decreased slightly and is warming 1F every 10 years.
As far as the correlation between a warm March and the date of the last 28 F freeze, there does not appear to be a strong correlation between the two. Years with an early warming trend can still fall victim to a late spring cold outbreak or a change in patterns.
REVIEW
Looking at the long-term and short-term trends, it appears the average March maximum temperatures are indeed increasing, quite possibly at an increasing rate. However, this doesn't seem to provide any confidence in the date for a late spring hard freeze. The long-term trend for last 28F freeze is occurring earlier in the year, but the short-term trends take us later in the year. In addition, the year to year variability in the last hard freeze date is quite large, which gives us little confidence to put our crops out in the fields any earlier.
If we look at 2015 data, the root of this question, the average March maximum temperature was 63 F, which is above the trendline in any given scenario. The date of the last 28F freeze was on April 21 (Julian Date=111), which is much earlier than the trendline would indicate. Even though temperatures were quite cold in May, the coldest it got was 29F on May 11, which is just above the threshold of "hard freeze".
It is important to remember that this data is from one station, at one location. There are numerous microclimate impacts surrounding each individual station that can impact the measurements, thus a weather station only miles down the road may provide different data and trends. In order to make a more concrete judgement on the trends for the area, more stations should be studied. So, take this for what it is worth....an analysis of the long-term and short-term March maximum temperature data and the date of the last spring 28 F freeze at the Scottsbluff Helig AP weather station.
THE GRAPHS
The blue line represents the last time during the spring the Scottsbluff weather station hit 28 degrees Fahrenheit from 1893-2014. The scale on the left is in Julian Days, which counts the days of the year starting on January 1. (Example: 91 is April 1 and 121 is May 1) The red line is the average max temperature during March for the given year in Degrees Fahrenheit (F). The solid black line is the 10 year moving average and the dashed black line is the long-term (1893-2014) linear trend for the date for the last 28F freeze. The solid orange line is the 10 year average max March temperature and the dashed orange line is the long-term (1893-2014) average max temperature. I have not calculated statistics on this data and the trends are based on data from NOAA-ACIS and visual clues from the graphs.
THE TRENDS
Just quickly looking at the data, the long-term trends are easy to find. The trend for the 28F freeze date is occurring earlier at a rate of about 5 days earlier for every 132 years. That is about one day earlier every 26 years. If we assume the the date of the first fall 28F freeze remains constant (it doesn't), the growing season is actually extending over the course of the recorded data. The average max temperature trend for March is warming by about 3F every 132 years, which is a warming rate of 1F every 44 years.
Depending on which years you focus on, the trends may change. If we look at the data from 1950 - 2014, the average last 28F freeze occurs 10 days later every 65 years. That is shortening our growing season by 1 day every 6.5 years, which is a trend in the opposite direction from the 132 year average. The March maximum temperature trend is warming by about 8F per 65 years from 1950-2014. That is an increasing trend of 1F every 8 years, which is a much steeper change than the 132 year average.
Looking at the last 30 years of data from 1985-2014 (not pictured), the trends shift again. The trend for the date of the last 28 F freeze is that it occurs 1 day later every 6 years. The March maximum temperature trend decreased slightly and is warming 1F every 10 years.
As far as the correlation between a warm March and the date of the last 28 F freeze, there does not appear to be a strong correlation between the two. Years with an early warming trend can still fall victim to a late spring cold outbreak or a change in patterns.
REVIEW
Looking at the long-term and short-term trends, it appears the average March maximum temperatures are indeed increasing, quite possibly at an increasing rate. However, this doesn't seem to provide any confidence in the date for a late spring hard freeze. The long-term trend for last 28F freeze is occurring earlier in the year, but the short-term trends take us later in the year. In addition, the year to year variability in the last hard freeze date is quite large, which gives us little confidence to put our crops out in the fields any earlier.
If we look at 2015 data, the root of this question, the average March maximum temperature was 63 F, which is above the trendline in any given scenario. The date of the last 28F freeze was on April 21 (Julian Date=111), which is much earlier than the trendline would indicate. Even though temperatures were quite cold in May, the coldest it got was 29F on May 11, which is just above the threshold of "hard freeze".
It is important to remember that this data is from one station, at one location. There are numerous microclimate impacts surrounding each individual station that can impact the measurements, thus a weather station only miles down the road may provide different data and trends. In order to make a more concrete judgement on the trends for the area, more stations should be studied. So, take this for what it is worth....an analysis of the long-term and short-term March maximum temperature data and the date of the last spring 28 F freeze at the Scottsbluff Helig AP weather station.
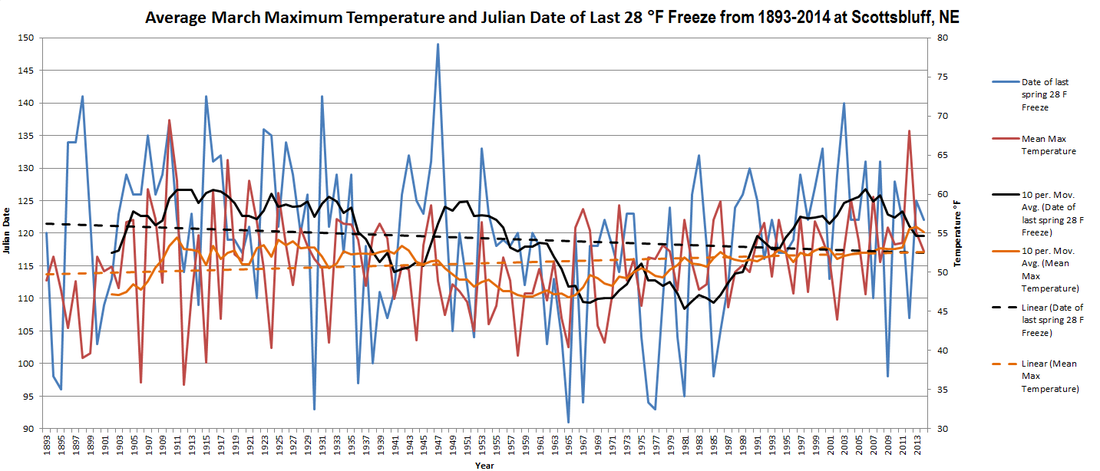
Average March maximum temperature and julian date of last 28 F Freeze from 1893-2014 at the Scottsbluff Helig AP Weather Station - Data from NOAA-ACIS
 RSS Feed
