|
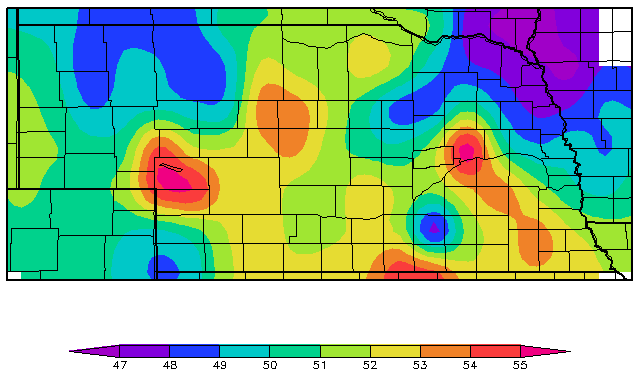
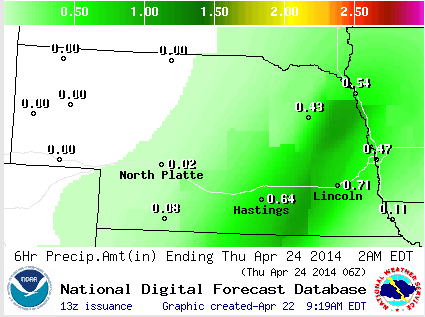
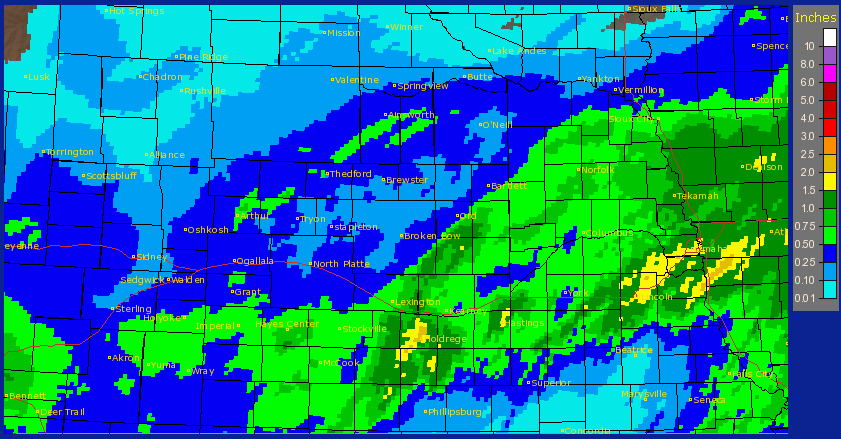
The map immediately below is the 7-Day average soil temperature (at 4 inches, on bare soil) ending yesterday for Nebraska. Most of the state has rebounded to be within a few degrees of normal. The bottom map is the Quantitative Precipitation Forecast for the 6 hour period ending Thursday at 2 am. A system will move through Wednesday afternoon/evening which will bring in chances of severe weather and measurable precipitation for the eastern half of the state. It will cool off Thursday and the cooler weather will hang around for another 7-10 days.
1 Comment
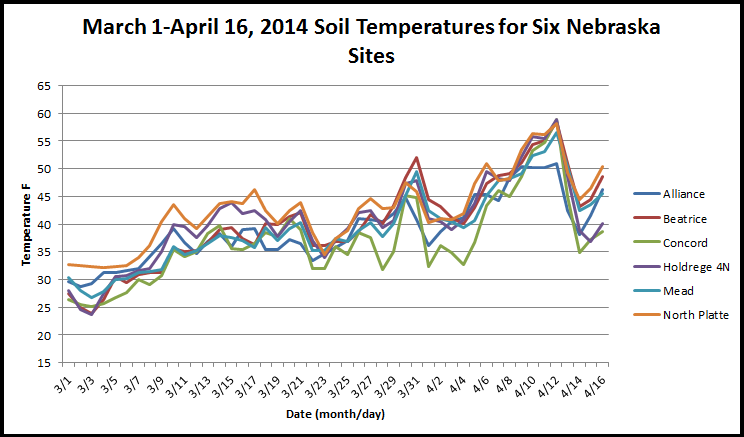
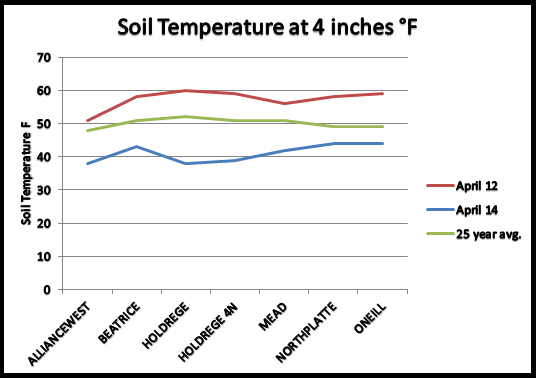
Here are the presentation recordings from the Corn Residue Baling and Grazing Conferences held in Elwood and Brule. Here are the topics: Weather data during cornstalk grazing season—Tyler Williams, UNL Grazing and Baling Projects in Nebraska—Aaron Stalker, UNL Residue Removal for Dryland, Limited and Full Irrigation—Bob Klein, UNL Residue Removal and Subsequent Crop Production -Charles Wortmann, UNL Residue Use Impacts on Soil Physical Properties—Humberto Blanco, UNL Soil Compaction —Tim Shaver, UNL Below is a graph of Soil Temperature data from select AWDN stations across Nebraska on April 12 and April 14. Some stations reported a decrease in more than 20 degrees F in three days. Soil temperatures are taken at a 4 inch depth under bare soils. Find more soil temperatures at cropwatch.unl.edu.
Map from the National Weather Service Advanced Hydrologic Prediction Service. View more maps here.
Here is the latest Nebraska Ag Climate Update....
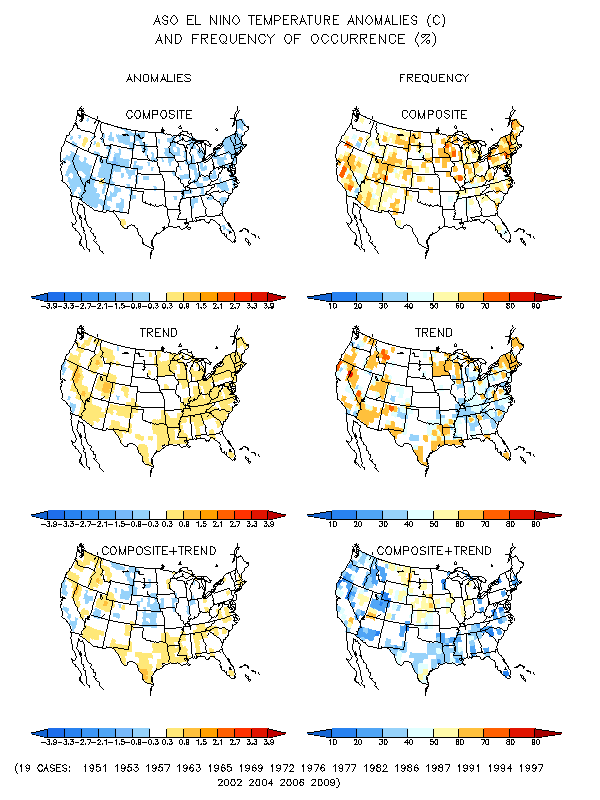
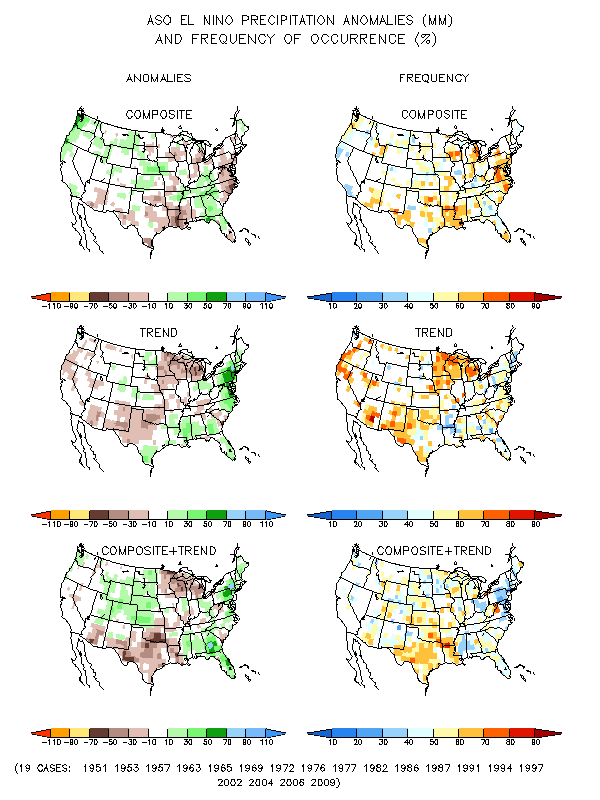
Last month the Climate Prediction Center predicted ENSO neutral conditions through the spring of 2014 and a 50% chance of an El Nino developing during the summer or fall. What does this mean for our temperature and precipitation patterns? The maps below (top-temperature, bottom-precipitation) show the trends and anomalies associated with an El Nino. In layman's terms, the left side of the maps below show the average anomaly from normal conditions, the recent trend of these anomalies, and the combination of the average anomaly and the trend. The right side of the map shows the frequency (basically the confidence) that these results materialize in a given El Nino event.
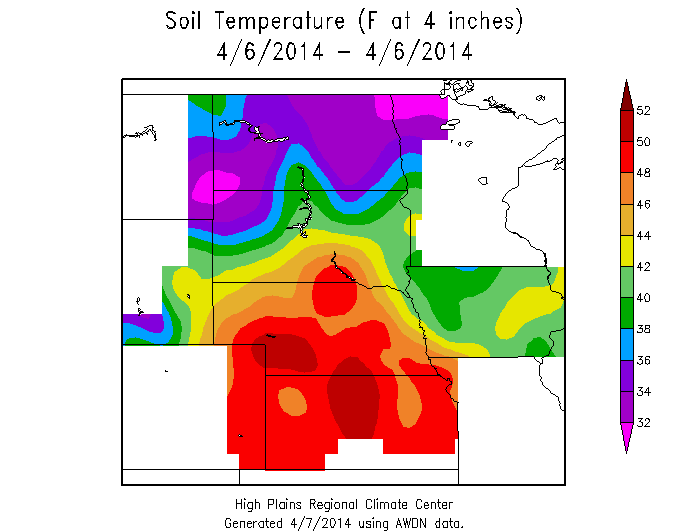
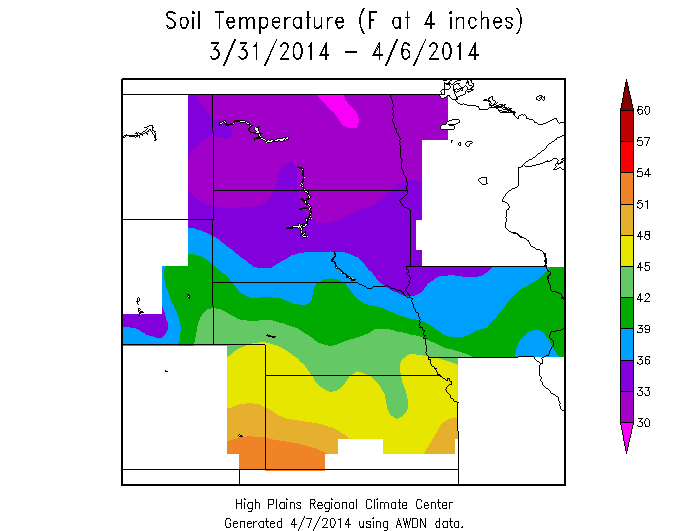
Click here for more maps and to compare other 3-month periods. Note: Maps are in metric units. Below are maps from the High Plains Regional Climate Center for the High Plains Soil Temperatures at 4 inches. The top map is the one day soil temperature as of April 6th and the bottom map is the 7 day average soil temperature. There has been a big jump in soil temperatures the last few days, which is evident by these maps. The short-term forecast will keep these soil temperatures increasing for most of Nebraska. Keep in mind that these temperatures are taken on bare soil, so in-field conditions will differ dramatically.
The video released from the NOAA Climate Prediction Center talks about potential spring flooding and the temperature and precipitation outlook through June. |
AuthorI study weather and climate impacts on agriculture, climate variability, and using weather and climate information to make better agricultural decisions. Archives
November 2017
|
||||||
| Ag Climate Nebraska |
|
 RSS Feed
