|
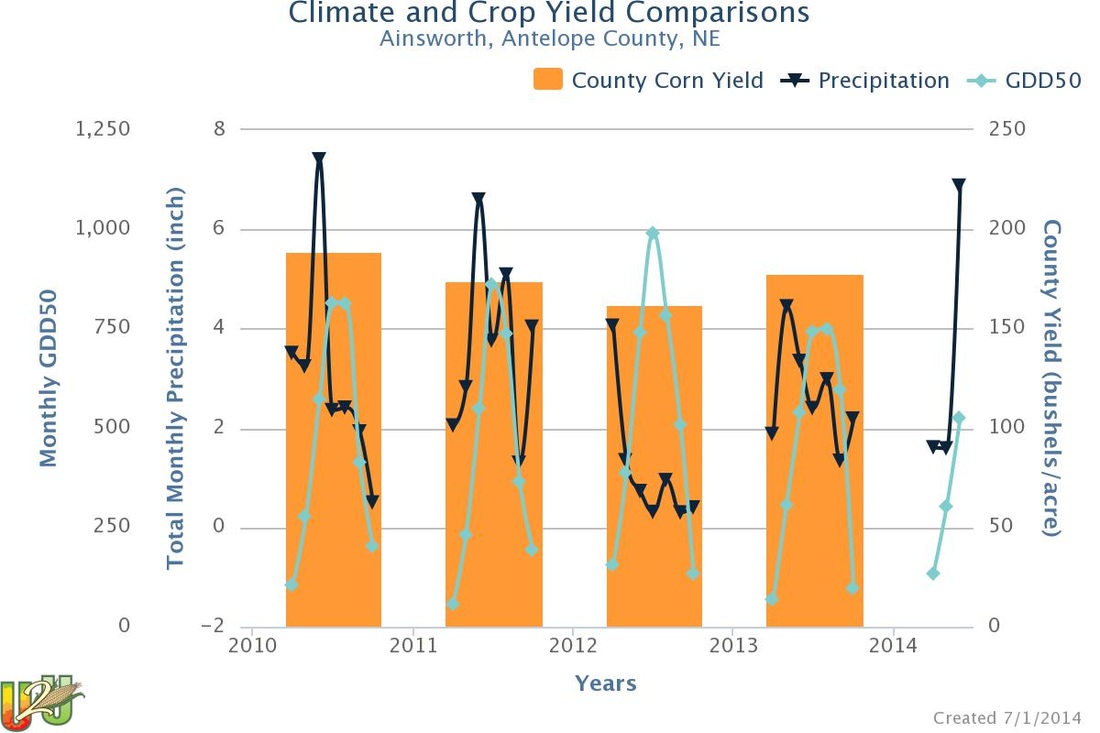
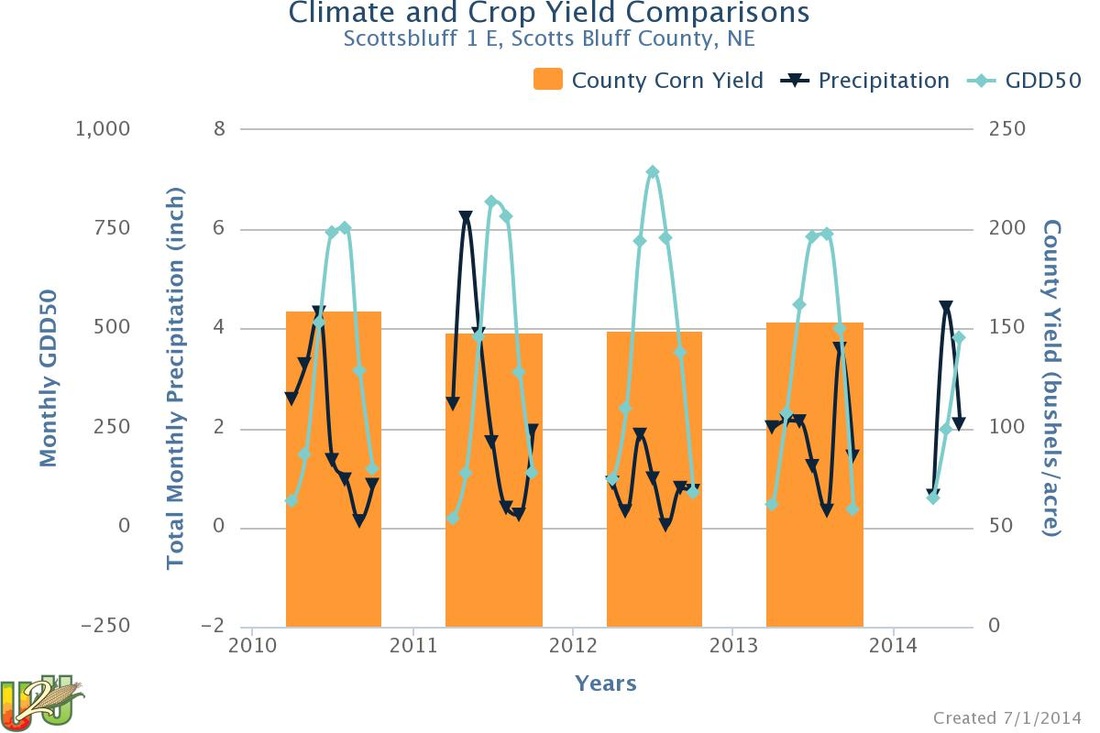
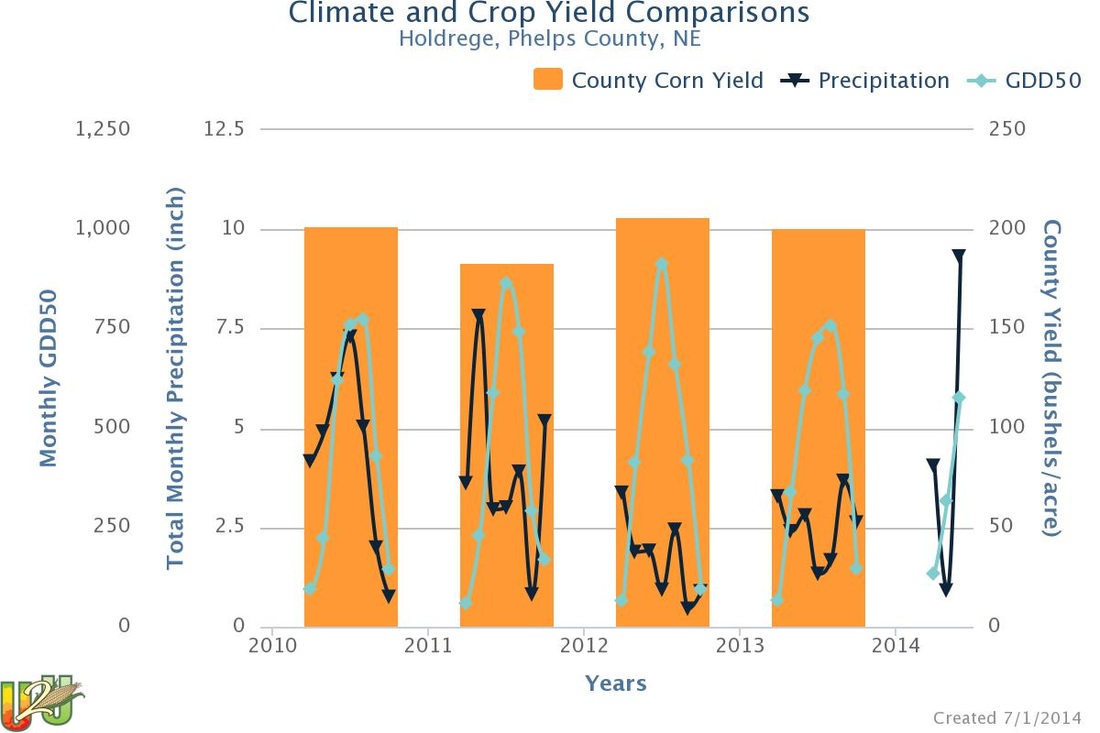
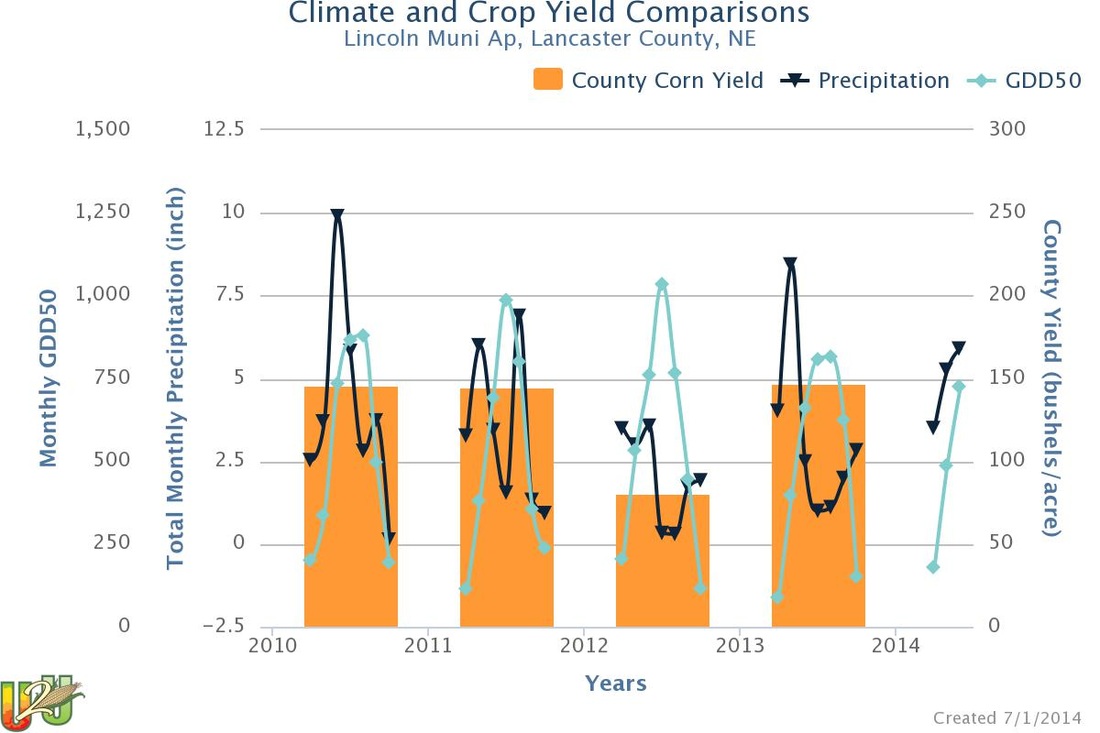
The graphs below show two climate variables (precipitation and growing degree days) compared to the county average corn yield for the corresponding year. The graphs are for four sites in Nebraska: Ainsworth, Scottsbluff, Holdrege, and Lincoln. The precipitation and GDD data are plotted for individual monthly amounts for April through October for each year. The 2014 points are for the April, May, and June accumulations of precipitation and GDDs. These graphs were created using the Ag Climate View Tool from the Useful 2 Usable project. County corn yield data is a combination of irrigated and non-irrigated fields.
0 Comments
Leave a Reply. |
AuthorI study weather and climate impacts on agriculture, climate variability, and using weather and climate information to make better agricultural decisions. Archives
November 2017
|
| Ag Climate Nebraska |
|


 RSS Feed
